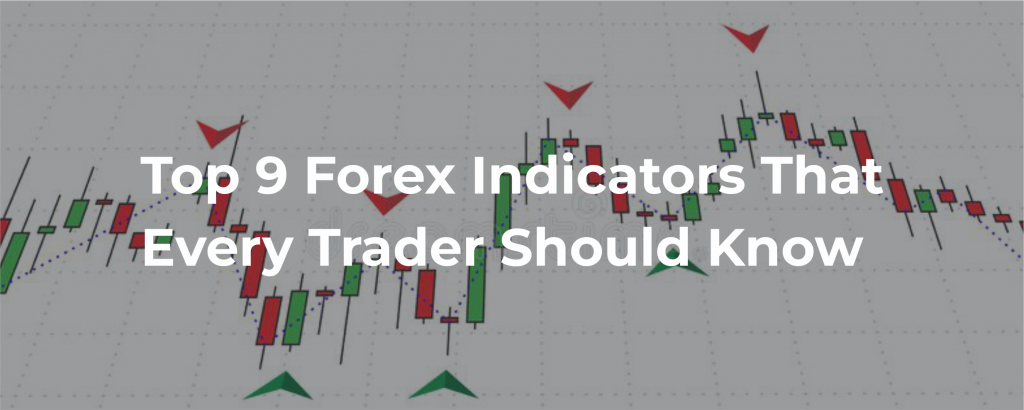
Forex Indicators are usually used to forecast price changes in the currency market. They are calculations that take the volume and price of a certain financial instrument into account.
By using Forex indicators, traders can make decisions about market entry and exit.
Forex Indicators are utilized by merchants consistently to expand the possibility creating a gain on the FX market while exchanging on Rallytrade.
Alongside different types of information and investigation, pointers can impact exchanging choices and might be utilized as the reason for Forex exchanging procedures.
With the capacity to inspect past market conduct and examples, merchants might have the option to utilize the best Forex indicators to assist with anticipating how the market will act from now on and, in this manner, which exchanges are probably going to be productive.

TYPES OF INDICATORS YOU CAN USE TO TRADE WITH RALLY.TRADE:
1. Moving Averages:
The moving average is one of the forex indicators that is the average price of the last number of candles that represent the overall sentiment of the price.
If the price is trading above the Moving Average, is it is an indication that buyers are controlling the price. On the other hand, if the price is trading below the moving average, it means sellers control the price.
Therefore, in your trading strategy, you should focus on buy trades if the price is above the moving average.
2. Relative Strength Index
This is another type of forex indicator that ranges from 0 to 100 levels. This indicator indicates where the price is likely to reverse.
In an uptrend, when the price moves above the 70 levels, it indicates a bearish market reversal. Similarly, if the price moves below the 30 levels in a downtrend, it indicates a bullish market reversal.
3. MACD
One of the most used forex indicators is MACD- Moving Average Convergence and Divergence
MACD is a trading indicator that consists of a histogram and an exponential moving average. The main purpose of this indicator is to calculate divergence with the price.
The regular divergence with MACD and price indicates a market reversal, while their hidden divergence indicates a market continuation.
Traders often use MACD as a primary indicator to create a trading strategy. On the other hand, you can use this indicator to find a possible market reversal point or a continuation point.
4. Bollinger Bands
John Bollinger created the Bollinger Bands indicator which is one of the forex indicators. The main element of Bollinger bands is moving averages. This trading indicator is very easy to use and provides a reliable trading entry.
The upper and lower line in Bollinger bands indicator works as dynamic support and resistance levels. Any rejection from these levels indicates a possible entry. Furthermore, any breakout from these levels also provides profitable trades.
5. Stochastic
Stochastic is a popular momentum indicator that was developed in the early 1950s. The main aim of this indicator is to identify the overbought and oversold zone.
Traders use this forex indicator to find the location from where the price is expected to reverse.
The Stochastic indicator moves from 0 levels to 100 levels.
If the price moves above the 70 levels, the price will likely reverse. On the other hand, if the price moves below the 30 levels, it creates the possibility of a bullish reversal.
6. Ichimoku Kinko Hyo
Ichimoku Kinko Hyo or the Ichimoku Cloud is one of the forex indicators with elements to create a complete trading strategy. Several elements in this indicator help traders to identify every aspect of the market.
The Kumo Cloud is the first element of this indicator that helps to understand the market context.
If the price is trading below the Kumo Cloud, the overall trend is bearish, and above the Kumo Cloud is bullish.
Ichimoku Forex Indicators on the other hand, Tenkan Sen and Kijun Sen are two important elements of this indicator that made with the concept of moving average. These two lines move with the price, and any rejection from these creates a trading entry.
7. Fibonacci
Fibonacci is a trading tool that shows the most accurate market direction as it is related to every creature in the universe.
The most significant part of the Fibonacci tool is the golden ratio of 1.618. In the forex market, traders use this ratio to identify market reversal and the profit-taking area.
If the price moves with a trend, corrects towards 61.8% Fibonacci retracement, and shows a market reversal, the price will likely move 161.8% Fibonacci extension level of the current leg.
8. Parabolic SAR
Parabolic SAR indicates the market trend of a currency pair. If the price is above the Parabolic SAR, the overall trend is bullish. On the other hand, if the price is below the SAR, the overall trend is bearish.
Traders use this indication to identify the trend. Furthermore, a market rejection from the Parabolic SAR indicator provides a potential entry point.
9. Pivot Point
Pivot point indicates the equilibrium level of supply and demand of a currency pair. If the price reaches the pivot point level, it indicates the supply and demand of the particular pair are the same.
If the price moves above the pivot point level, it indicates that the demand for a currency pair is high.
However, if the price moves below the pivot point, the supply would be high. In the financial market, price tends to move at the equilibrium point before setting any direction. Therefore, this trading indicator provides a possible trading entry from the rejection of the pivot point.
Trade the forex market with the best forex broker in Nigeria. Visit www.rally.trade to get started
